Tracing through your distributed applications using AWS X-Ray
On my last livestream session with the AWS DevAx Connect team, I talked about how you can build observability into distributed applications on AWS Lambda (among other things), particularly using AWS X-Ray.
With all the positive buzz around the whole idea of microservices and immensely distributed applications, one of the very real problems it creates is that --- now that most everything in your application is a Lego piece in a great, big whole --- how do you keep an eye on all of those moving pieces? When one of your users complains that your service is responding very slowly, which of the hundreds (or even thousands) of pieces a single API call even lightly interacts with could be the culprit? When an exception or error breaks out, where exactly did it come from?

This is a question that's been asked of me time and time again, and something that I'm always a bit surprised how it's not given more thought by more people --- at least not until much, much later in the engineering process. Oftentimes, by then there would already be a fire being put out, and everyone would then be wishing that they had focused on a solution much, much sooner.
Setting the stage
In the livestream, I shared that I've prepared a demonstration serverless project using the Serverless Framework. Once deployed, it exposes a single API endpoint that generates a random string you can then use to name one of your new projects. Snazzy!
When an HTTP request is received through Amazon API Gateway, an entrypoint AWS Lambda function handles it. This handler then selects, at random, one Lambda handler from each of five different services: nouns, adjectives, verbs, colors, and descriptors. Each service, by default, has ten Lambda functions up for grabs.
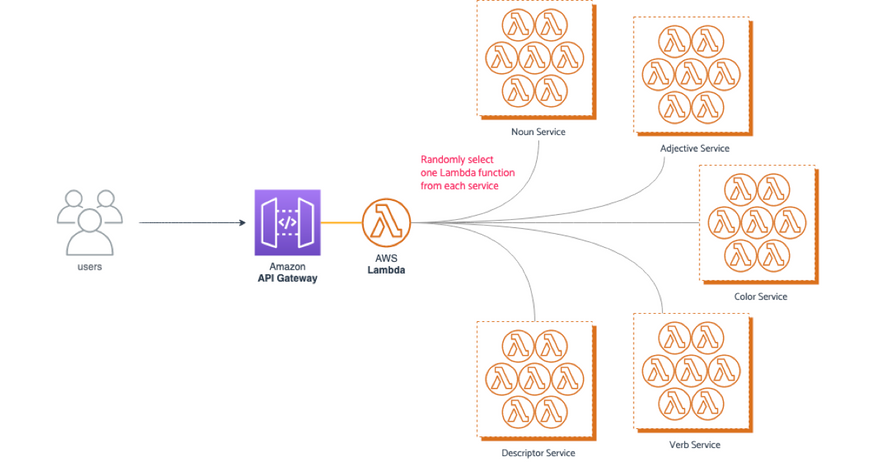
Now, it has to be said that this definitely isn't how something like this should be built, and the setup is, as the README file says, somewhat convoluted. But while it's not quite how a real-life application would be built (at least I hope not!), it does mimic how a bunch of small services can talk to one another to address an end-user request.
Enabling tracing through AWS X-Ray
Let's start putting in the tracing functionality.
Enabling tracing on your Lambda functions is pretty easy — you just have to tick a checkbox on the Lambda function's dashboard.
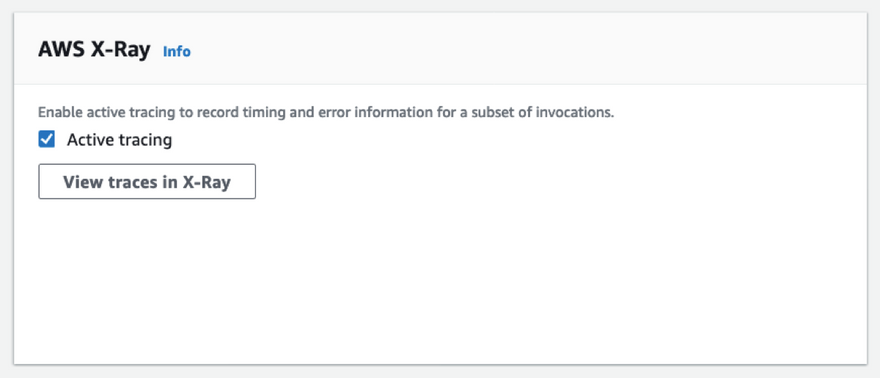
However, when you're managing multiple Lambda functions in your application (as you most probably are going to be), toggling it this way, going through your functions one by one, is not gonna be fun.
If you're using the Serverless Framework, it fortunately has an easy way to enable tracing across your entire workload. Just add the following to your serverless.yml manifest, under the provider section:
provider:
  name: aws
  runtime: nodejs12.x
  stage: dev
  region: ap-southeast-1

  tracing:
    lambda: true
    apiGateway: true

  iamRoleStatements:
    - Effect: Allow
      Action:
        - lambda:InvokeFunction
        - xray:PutTraceSegments
        - xray:PutTelemetryRecords
We're adding in a couple of IAM permissions at the bottom just to be sure --- when you're toggling tracing on the Lambda console, these will be automatically added to your Lambda function's execution role if they're not there yet. But, of course, if you know you need it, it's better to be explicit about it, so let's just add those in.
These changes make it so that whenever requests go into the API Gateway, and invoke any of the Lambda functions on this application, X-Ray will know about it, and will be able to map your traces accordingly.
What this doesn't do is trace whatever else your Lambda functions may be calling --- if your functions talk to other AWS services (e.g. it writes into an Amazon DynamoDB table, or it fetches a file from an Amazon S3 bucket), we won't be able to trace those yet.
So let's add that functionality in.
Going the full mile with tracing
Extending the traces to whatever else we're calling from our Lambda functions is really simple to do as well --- and it works with anything that you're using the AWS SDK in, not just Lambda functions.
We'll need to add in the AWS X-Ray SDK
npm install --save aws-xray-sdkI'm using the AWS X-Ray SDK for Node.js here, but there's a handful of other options you can use depending on your preferred language. Check out the AWS Developer Guide for more info.
Afterwards, all you have to do is to wrap the AWS SDK with the AWS X-Ray SDK everywhere in your code that you're using it. So, for example, in src/handlers/entrypoint.js in the demo project, you can do it like this:
// :: bring in the X-Ray SDK
const AWSXRay = require('aws-xray-sdk-core')

// :: ... then you can either wrap your AWS SDK like this:
const AWS = AWSXRay.captureAWS(require('aws-sdk'))

// :: ... or maybe like this:
const { Lambda } = AWSXRay.captureAWS(require('aws-sdk'))
Now, most any other AWS service we call from our Lambda function will automatically have tracing information embedded in them, so when we view your service map later on AWS X-Ray, you'll see exactly where and when your requests are jumping to.
At this point, you're already done.
Your application will start tracing all the requests going through it. If you want to check out how it looks in action, however, read on. We'll set up an installation that will send a lot of requests into it so you can see how the tracing is done.
You're curious to see how it looks
Of course you are.
If everything was set up correctly, all requests going through the application (through the API Gateway) will now have tracing information that's followed by X-Ray across all your AWS resources.
Setting up a load testing platform
We'll generate a huge load of requests, just like how you'd most probably do it if you were load testing an application. (Which you really should be doing, by the way.)
I like to use Nordstrom's serverless-artillery for this --- which coincidentally also uses the Serverless Framework, so setting it up is going to be pretty familiar.
npm install -g serverless-artillery

mkdir loadtesting     # :: or wherever you want to store your load testing manifest
cd loadtesting

#  :: this will generate a load testing starter manifest
slsart script
This will generate a script.yml file containing the information that serverless-artillery will need to run your load tests. Try switching out the contents of that file with the following (feel free to tweak, if you'd like):
config:
  # :: Change this to the URL of your API Gateway entrypoint
  target: 'https://xxx.execute-api.yyy.amazonaws.com/dev/generate'

  # :: These are your testing phases.
  #    This configuration sets up the load test so that:
  #      1/ For the first 15 seconds,
  #         start with 10 requests / sec,
  #         and steadily increase that to 25 requests / sec,
  #      2/ Then for the next 60 seconds,
  #         maintain a constant 25 requests / sec rate
  phases:
    - duration: 15
      arrivalRate: 10
      rampTo: 25
    - duration: 60
      arrivalRate: 25

# :: This section allows you to define more complicated scenarios,
#    but we won't use this for now.
#    What this setting currently does is just send the HTTP GET requests to the root
#    of the target URL as specified above.
scenarios:
  - flow:
      - get:
          url: '/'
Then we need to deploy that to your AWS account as well:
slsart deploy --stage my-test-setupIt'll take a few minutes, but when the deploy is done, we can then instruct it to run the load testing scenario above:
slsart invoke --stage my-test-setupInspecting the traces
It'll take a few seconds for the tracing information from the requests to be available at AWS X-Ray, but go ahead and go to your X-Ray Console anyway.
Navigate to your Service Map, and you should get a pretty cool graph of nodes in your application, as well as the connections between them:
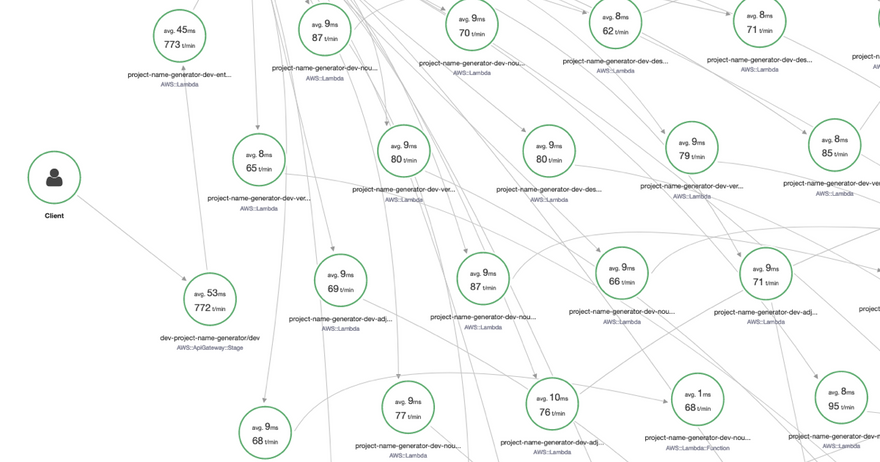
Awesome, but aside from a few nice latency and transaction rate numbers we can pat ourselves on the back with, there isn't much else this is telling us. So let's try introducing some errors into the stack, and see how that will affect our map.
Add in some artificial defects
I'll change some of the Lambda handlers so that:
- one of them takes a much longer time to respond, and
- one of them generates an
HTTP 4xxerror half of the time
We have a total of 50 handler functions here, and just having to fish out two faulty ones without tracing tooling is a pretty tedious effort --- imagine if we had hundreds of these services up and running.
I'll add the following code blocks to the handlers:
// :: src/handlers/adjective.js

// :: mock a handler that takes an abnormally long time to resolve
export const faultyHandler = async () => {
  return new Promise((resolve) => {
    const response = handler()
    setTimeout(() => resolve(response), 2000) // :: resolve after 2 sec
  })
}
// :: src/handlers/verb.js
// :: throw an error half of the time
export const faultyHandler = async () => {
if (Math.random() > 0.5) return handler()
// :: ---
throw new Error('DEFECT')
}Then we'll adjust src/handlers/functions.js to take the faulty handlers into account:
// ...

const createHandler = (type, i) => {
  const isFaulty =
    (type === 'adjective' && i === 4) ||
    (type === 'verb' && i === 6)

  const handler = isFaulty ?
    `src/handlers/${type}.faultyHandler` ||
    `src/handlers/${type}.handler`

  return {
    [name]: { handler }
  }
}

// ...
Finally, we'll deploy the faulty handlers:
sls deploy -f adjective-4
sls deploy -f verb-9
Then run the load tests again.
This time, when you look at your service map, you'll easily see where in your application you're experiencing degraded performance:
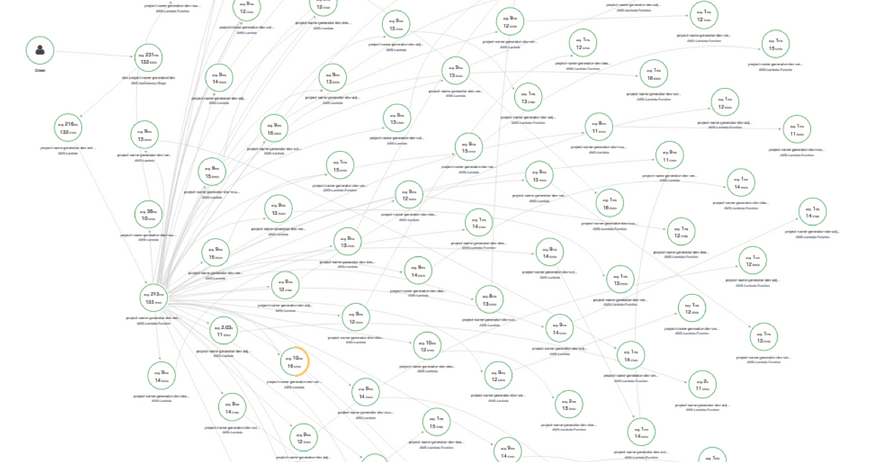
You can select any node in the map to look more into it. When you select a node, you can isolate the map to just that part of the application, and see the resulting distribution of performance results.
You can also click through the Analyze Traces button to view the traces in detail. Let's do that to investigate our response time behavior.
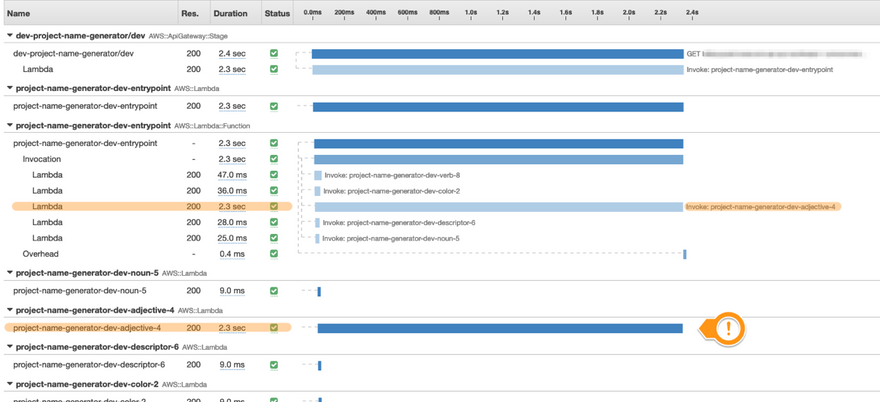
Let's say we wanted to investigate all the requests in our application that are taking longer than 1.5 seconds to complete --- we can do that by searching for responsetime > 1.5 on the search input bar. (You can click on the help button to see how the search syntax works.)
This will give you a list of traces in your application that logged a response time of, expectedly, longer than 1.5 seconds. Click on one of the traces, and you'll see a dashboard with a trace map of all the services involved in that trace, as well as a timeline of events making up that entire trace:
There's definitely more to this
Having active tracing available for your applications make it so much simpler to perform investigations for debugging, as well as for just keeping an eye on all your services, and making sure they're behaving as expected.
This is definitely just scratching the surface of it, and if you want to know more about what else you can do with AWS X-Ray, then don't miss checking out the AWS Developer Guide for it.